 Deutsch
 English
 Français
Do you have a question?
Get in touch with me. Feel free to call me or send me an e-mail message. I look forward to the dialogue with you!
Would you like to measure interdependencies? Would you like to know what the main drivers are for satisfied customers in your company? Here, very elaborate experiments with test and control groups are usually suggested, which are very costly, time-consuming and often hardly feasible. Our solution for these kinds of questions: structural equation models.
By means of a structural equation model, complex causal processes with directly and not directly observable variables – such as image or customer loyalty – can be measured. The advantage here is that the effects are not considered in isolation, but can be examined and measured in the realistic logical sequence (path model). This makes it possible to identify main drivers that show you which lever has the greatest effect on your goal.
For example, you would like to know how you can efficiently increase the satisfaction of your customers? With the structural equation model, we can show you what has the greatest impact on the satisfaction of your customers and where you need to start in order to achieve an increase in satisfaction.
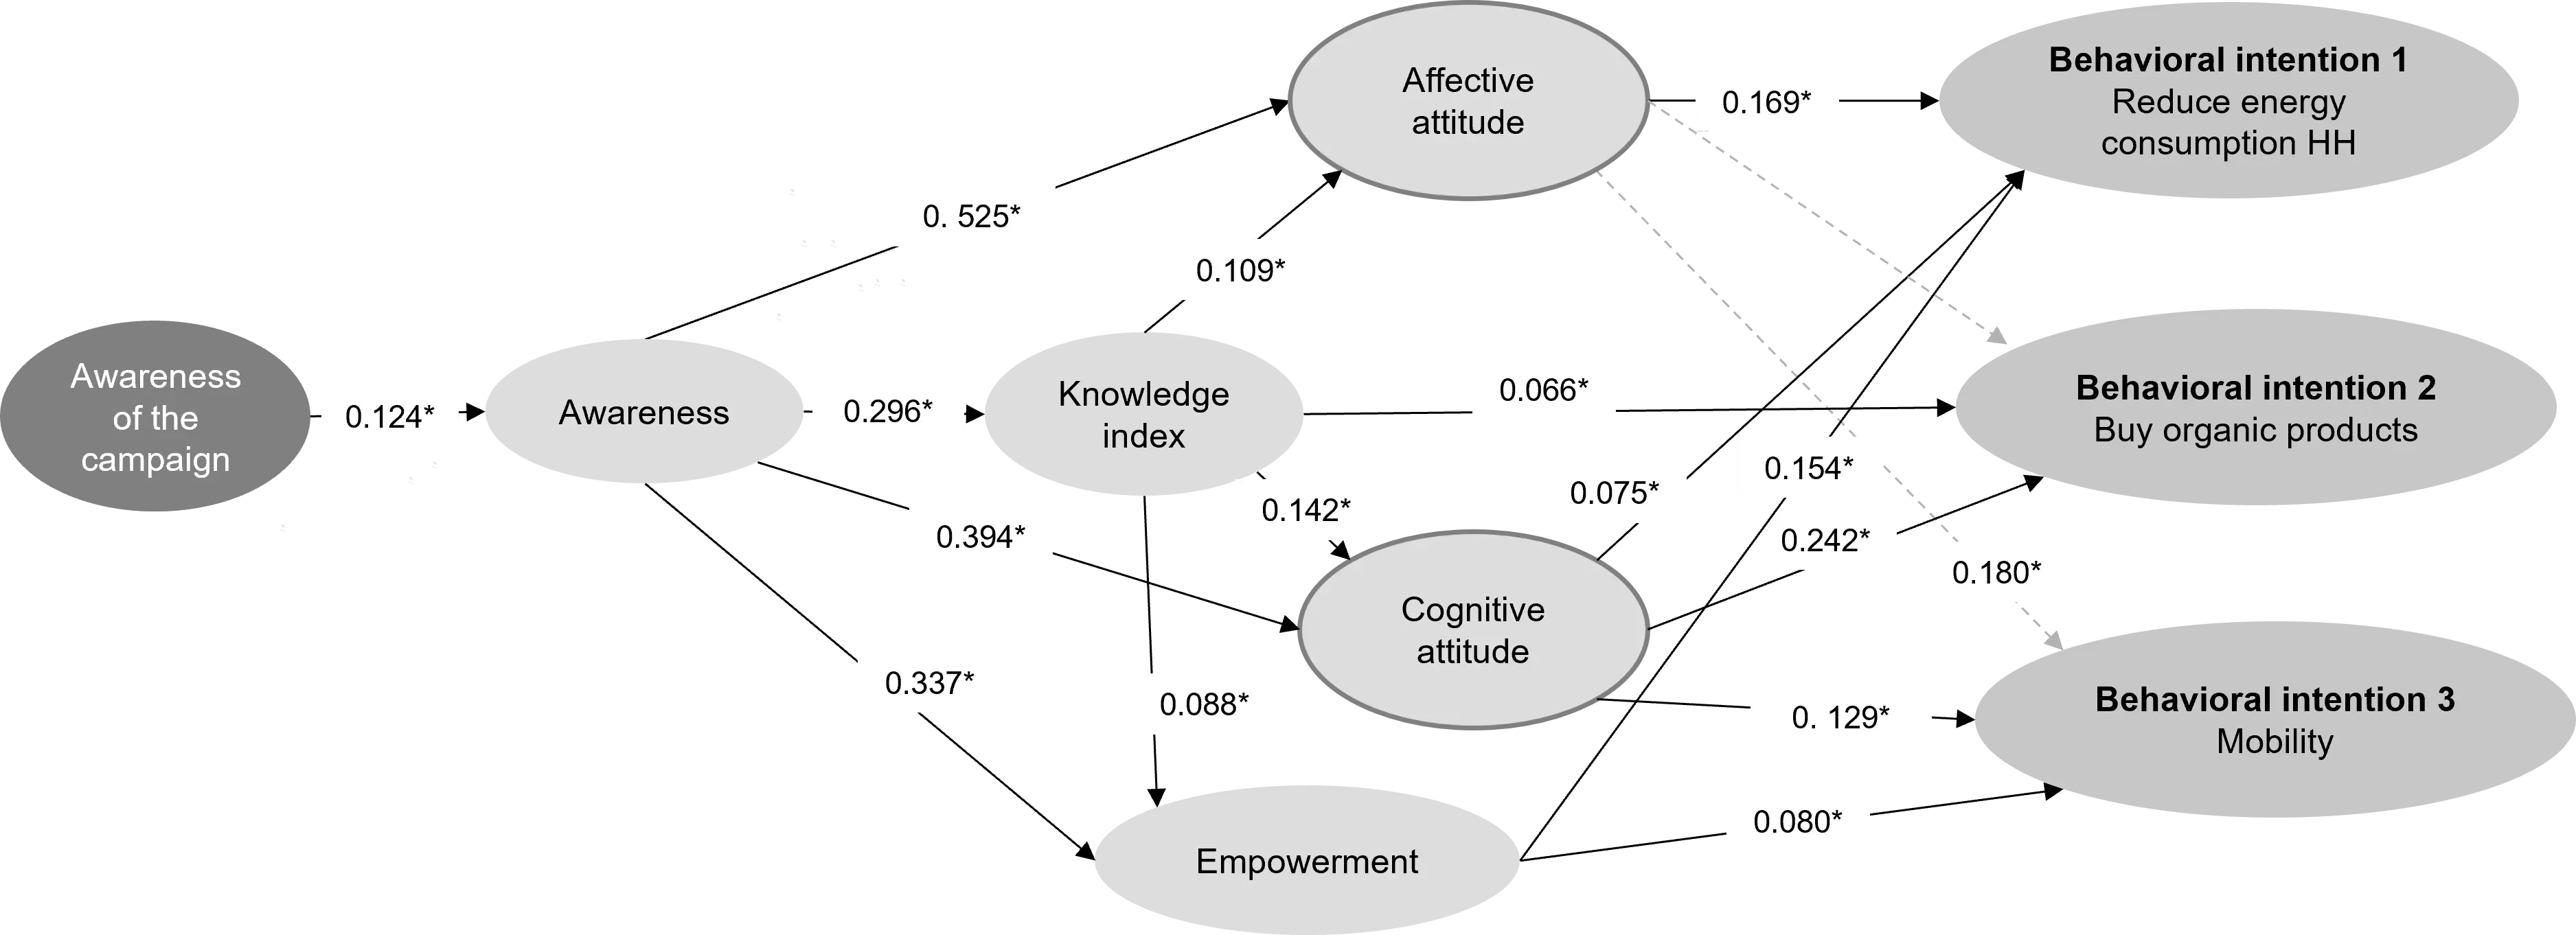
Or would you like to know whether your campaign actually leads to the desired change in attitude and thus also to a change in behaviour? Using structural equation modelling, we can check whether a campaign has the desired effect or not.
We use the method of partial least squares (PLS) structural equation models. In order to be able to calculate a target-oriented structural equation model, the path model must initially be properly prepared with the assumed hypotheses and cause-effect relationships. It is not advisable to apply such a model in a purely exploratory manner.
The structural equation model combines factor analyses, regression analyses and path analyses, which are all calculated simultaneously. Factor analysis allows variables that are not directly observable, such as image, customer loyalty and attitudes, to be measured and integrated into the model. Regression analysis can be used to show causal relationships between individual variables and path analysis can be used to consider causal relationships between several variables.
Using multi-group analysis (MGA), different data groups (such as men vs. women or different regions) can then be calculated simultaneously, but considered separately and compared with each other in order to uncover significant differences in individual pathways or indicators. In this way, differentiated value drivers and impact pathways can be identified for different groups.

Get in touch with me. Feel free to call me or send me an e-mail message. I look forward to the dialogue with you!